
The Market’s Character
Macro Narrative - In the first few weeks of 2023 investors have been bullish on disinflation. After a year of hawkish Fed policy and rate hikes, inflation is finally coming down. Investors are adding equity exposure to front-run the Fed pivot to a more dovish policy. Rate cuts are expected in the Fall, and the market always looks ahead 6 to 9 months. The expectation of the Fed pausing and then reducing interest rates this year has led to a resurgence in tech and growth stocks and a rotation out of defensive sectors (healthcare, consumer staples and healthcare). Offensive sectors (technology, consumer discretionary, financials and communications) have fared much better this year. The S&P 500 currently has a forward P/E ratio of 16.32x, using 2024 estimated earnings of $250. At his level, the market is fairly valued, for a non-recessionary environment, but not cheap.

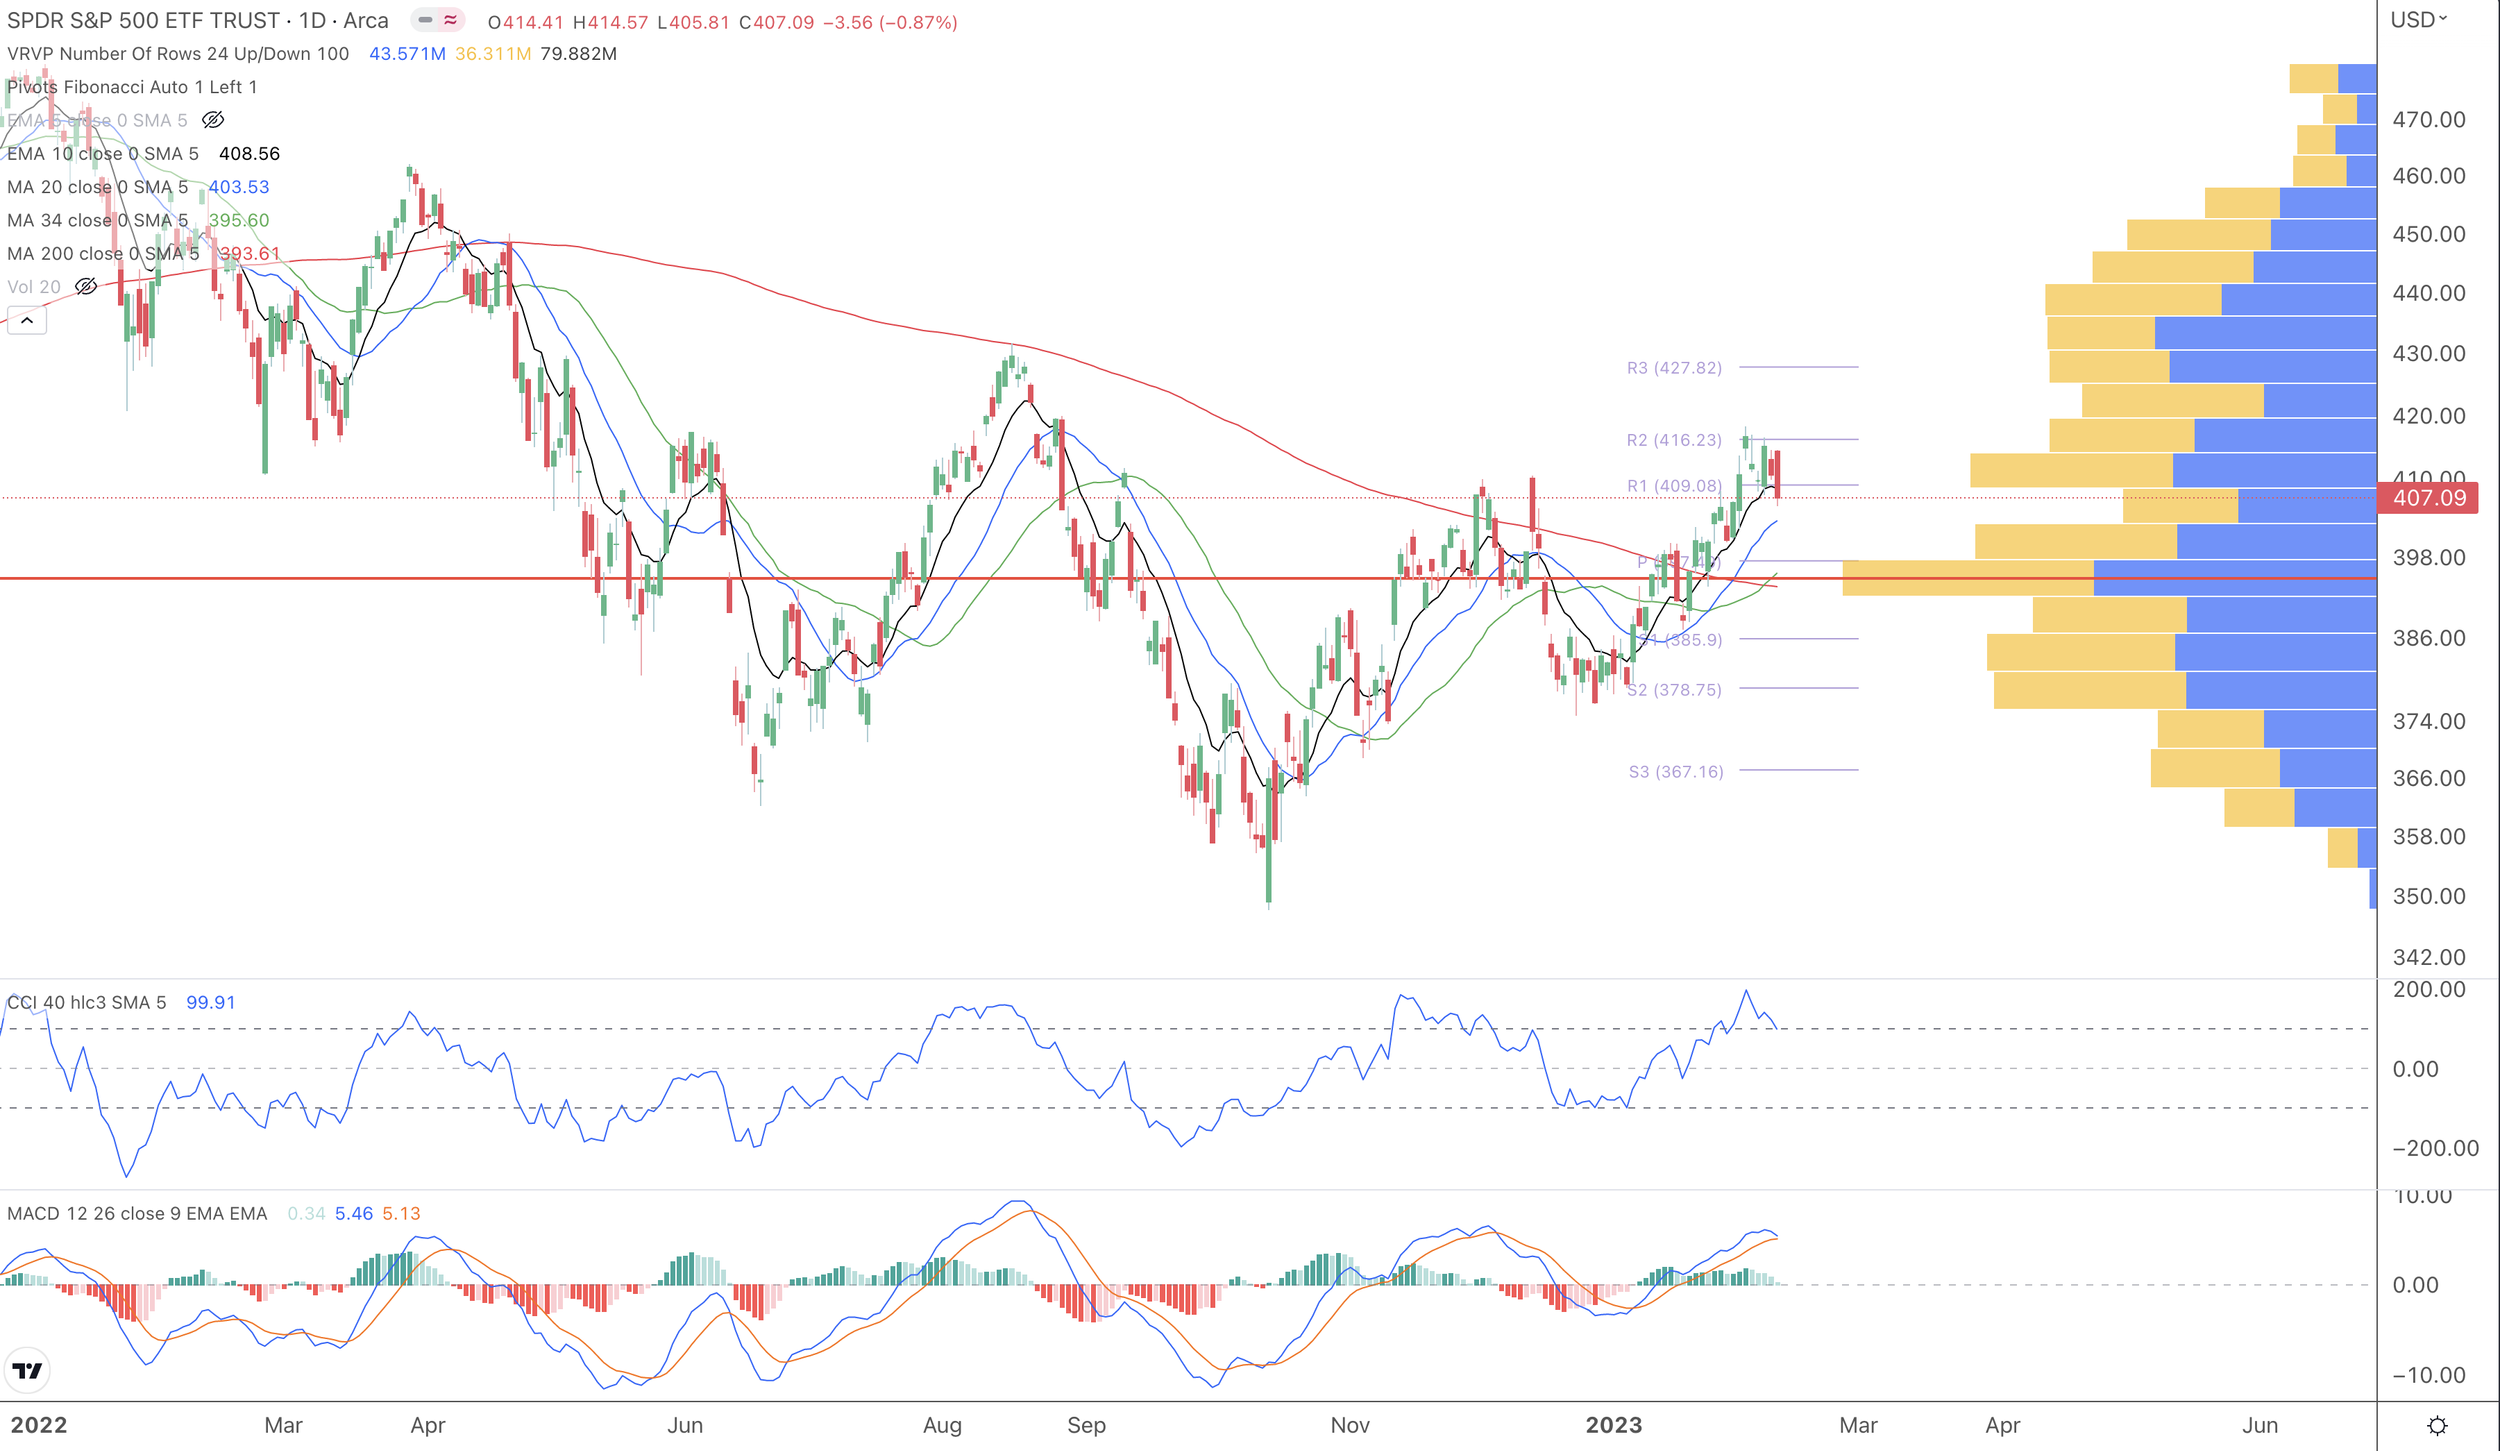
Technical Analysis - The S&P 500 had a stellar January but is now running out of gas and could be due for a pullback or consolidation. Notice how the CCI indicator is in the overbought area and beginning a downtrend. The MACD is also showing waning momentum and is about to make a bearish crossover. The SPY ran from a support pivot point straight to a resistance pivot point, which is quite normal. It is also quite normal for it now to pull back to the pivot point at $397, or a support pivot point at either $386 or $378. Given the recent strength in the market, a more mild drop to the $397 to $395 area is more likely. This region also has the confluence of 1) the pivot point, 2) the Volume Profile Point of Control (red horizontal line, where most volume has been traded over the past year), 3) the 34-day simple moving average, and 4) the 200-day simple moving average. A drop to the $395 level would only be a 3% decline and could provide an opportunity for the market to catch its breath and reload for another leg higher.
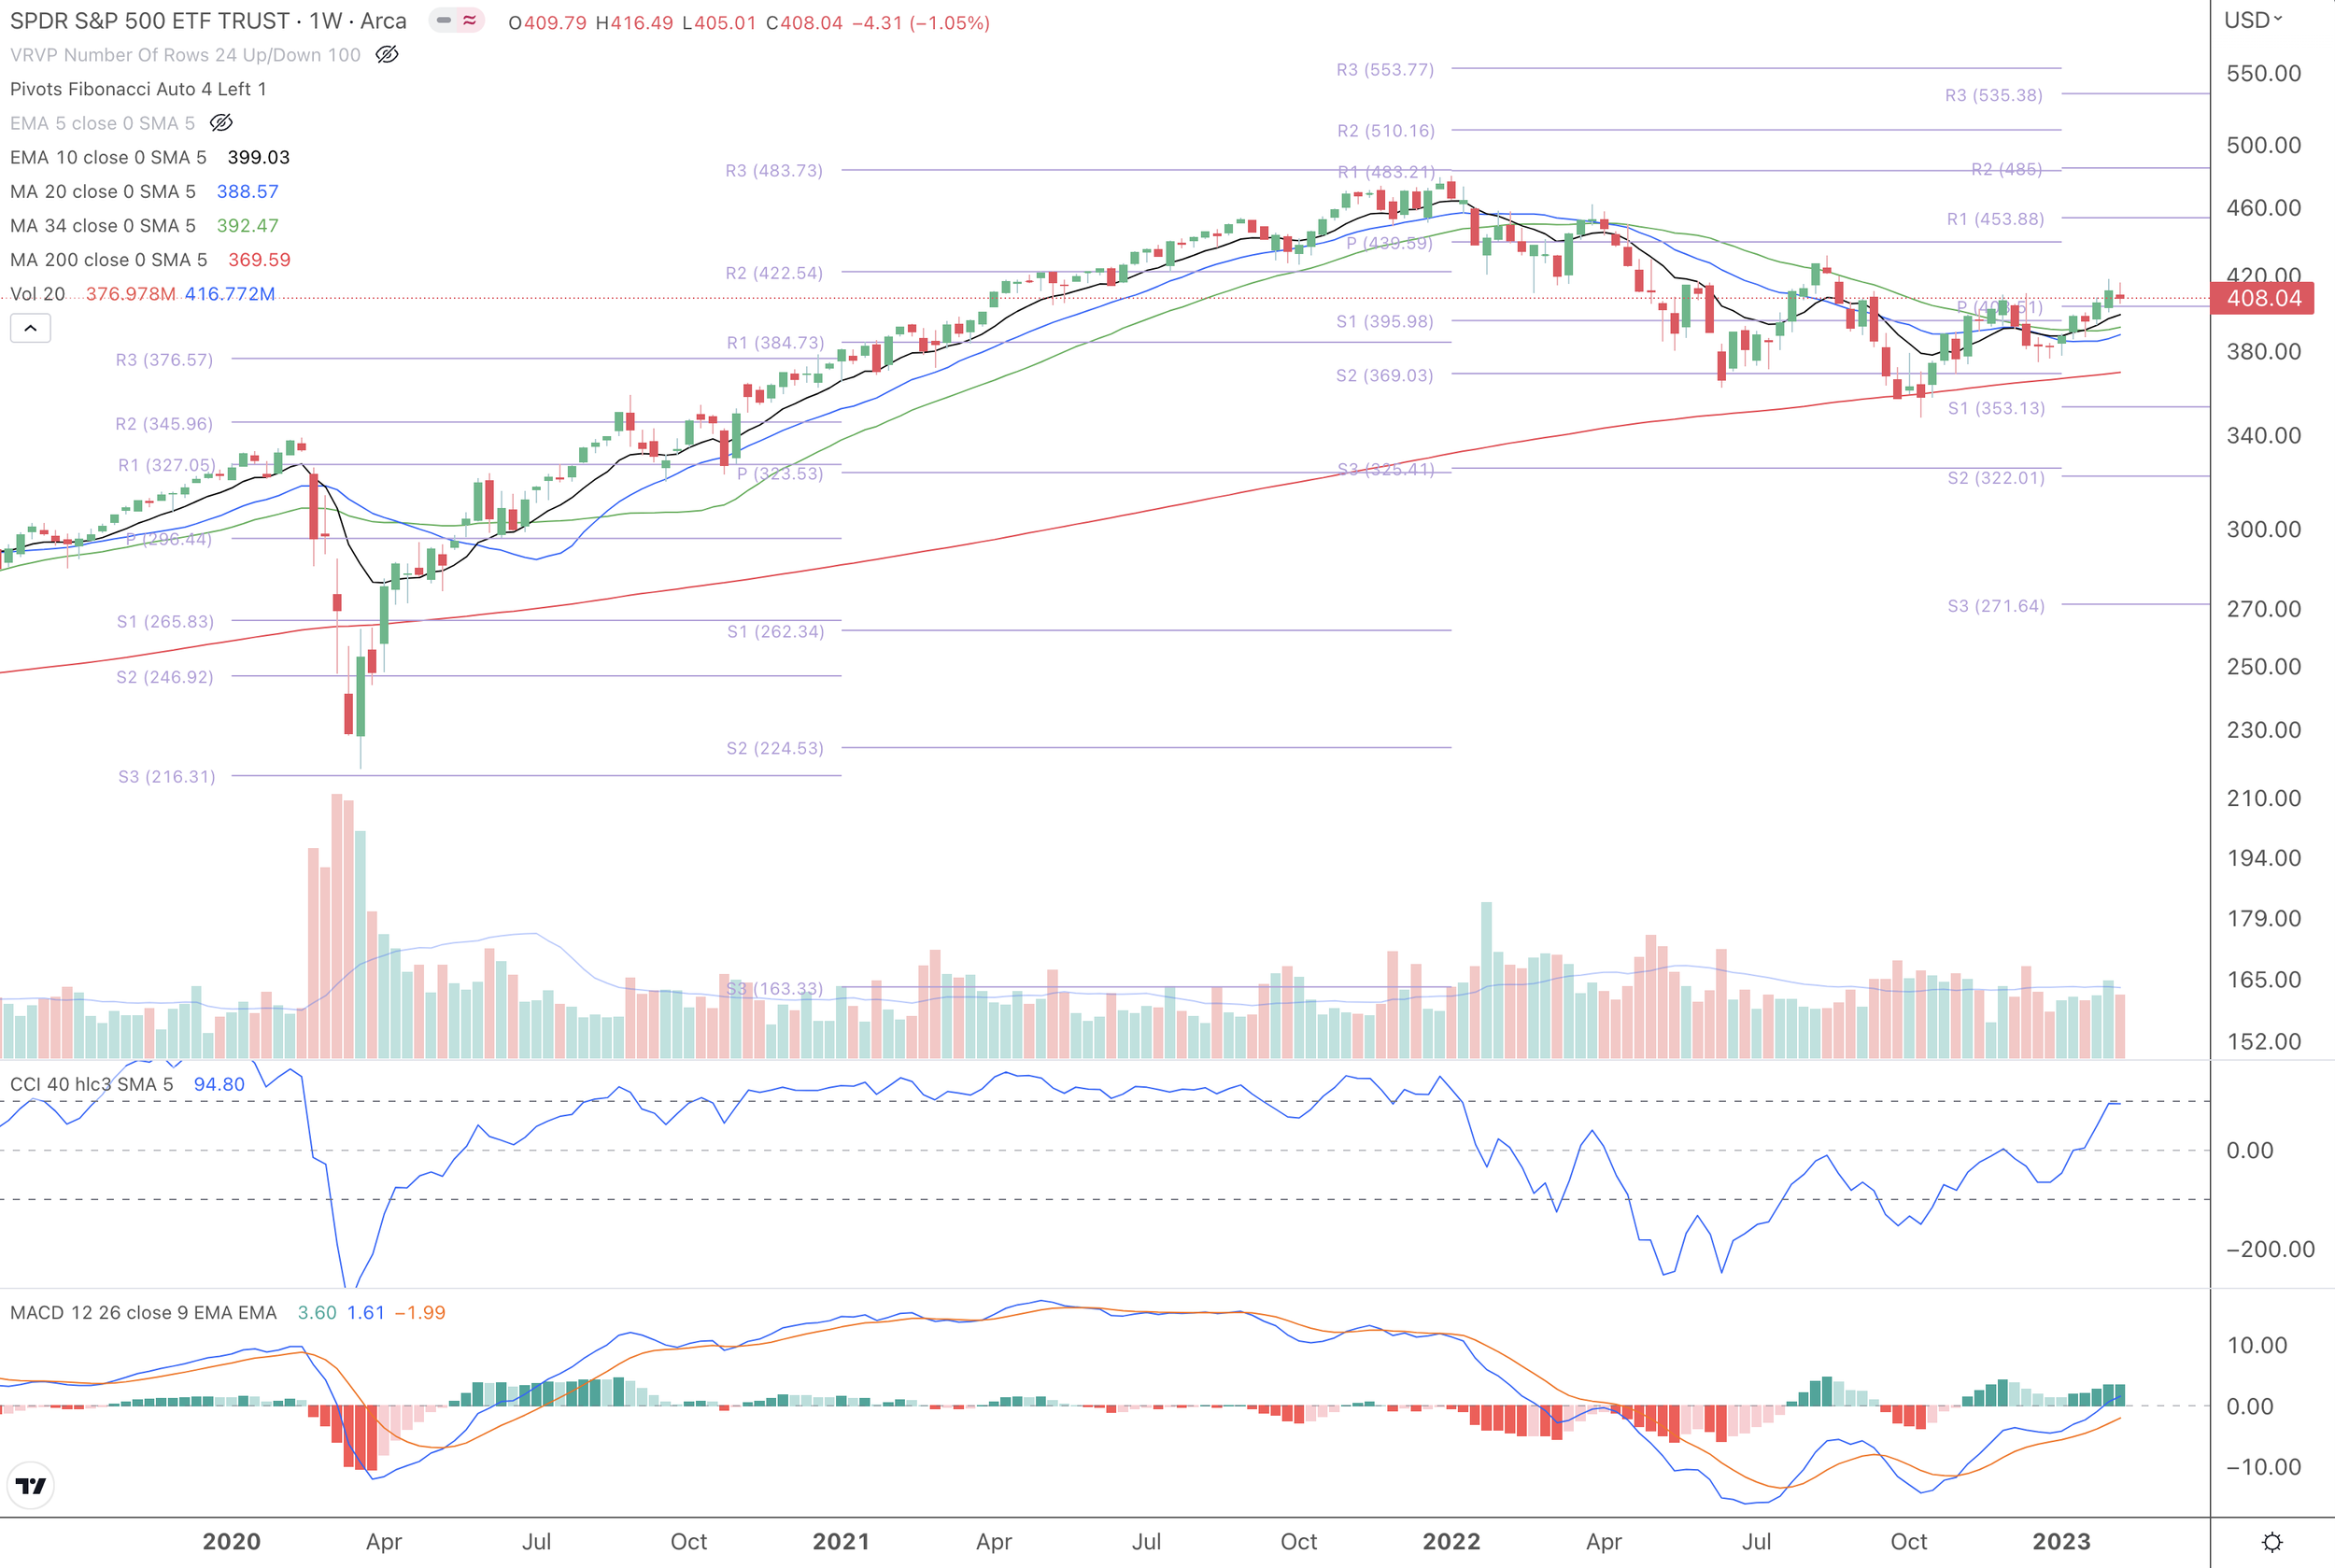
To see the possible range annual range for the SPY, I use pivot points. Looking at the chart below you could see how the high, low, and close for a given year has an uncanny way of touching pivot points. For 2023 there are resistance pivot points at $$454, $485, and $535 (low probability). On the downside, there are support pivot points at $353, $322, and $271 (low probability).
Intermarket Analysis - Adding fuel to the recent rally was the Intermarket combination of a falling US Dollar and a falling 10-year Treasury rate (TNX). This has begun to reverse as the US Dollar and the TNX have started to retrace. This could support a pullback in the market as a rising dollar and rising rates are inversely correlated to equities.

Market Internals - The breadth picture has definitely improved in 2023. New Highs are outpacing New Lows and the Advance/Decline line (ADV) has shown a steady trend of rising breadth. Advancing Volume/Declining Volume (ADV) has also been supportive in 2023. However, both the ADL and ADV have begun to lose steam over the past few trading sessions as the VIX has started a new uptrend. These conditions also support an upcoming pullback or consolidation.

Sentiment - The Fear & Greed Index is in the Extreme Greed area and is starting a downtrend. Buyers who came bought late in the trend could sell out if their positions become underwater. This could give legs the next pullback.

Options-Based Levels - For Friday 2/17, there are many put walls, which could serve as support levels. There are put walls at $400, $395, $390, $380, and $375. It is highly unlikely that the pullback would surpass $375 to the downside. The Max Pain level is at $400.

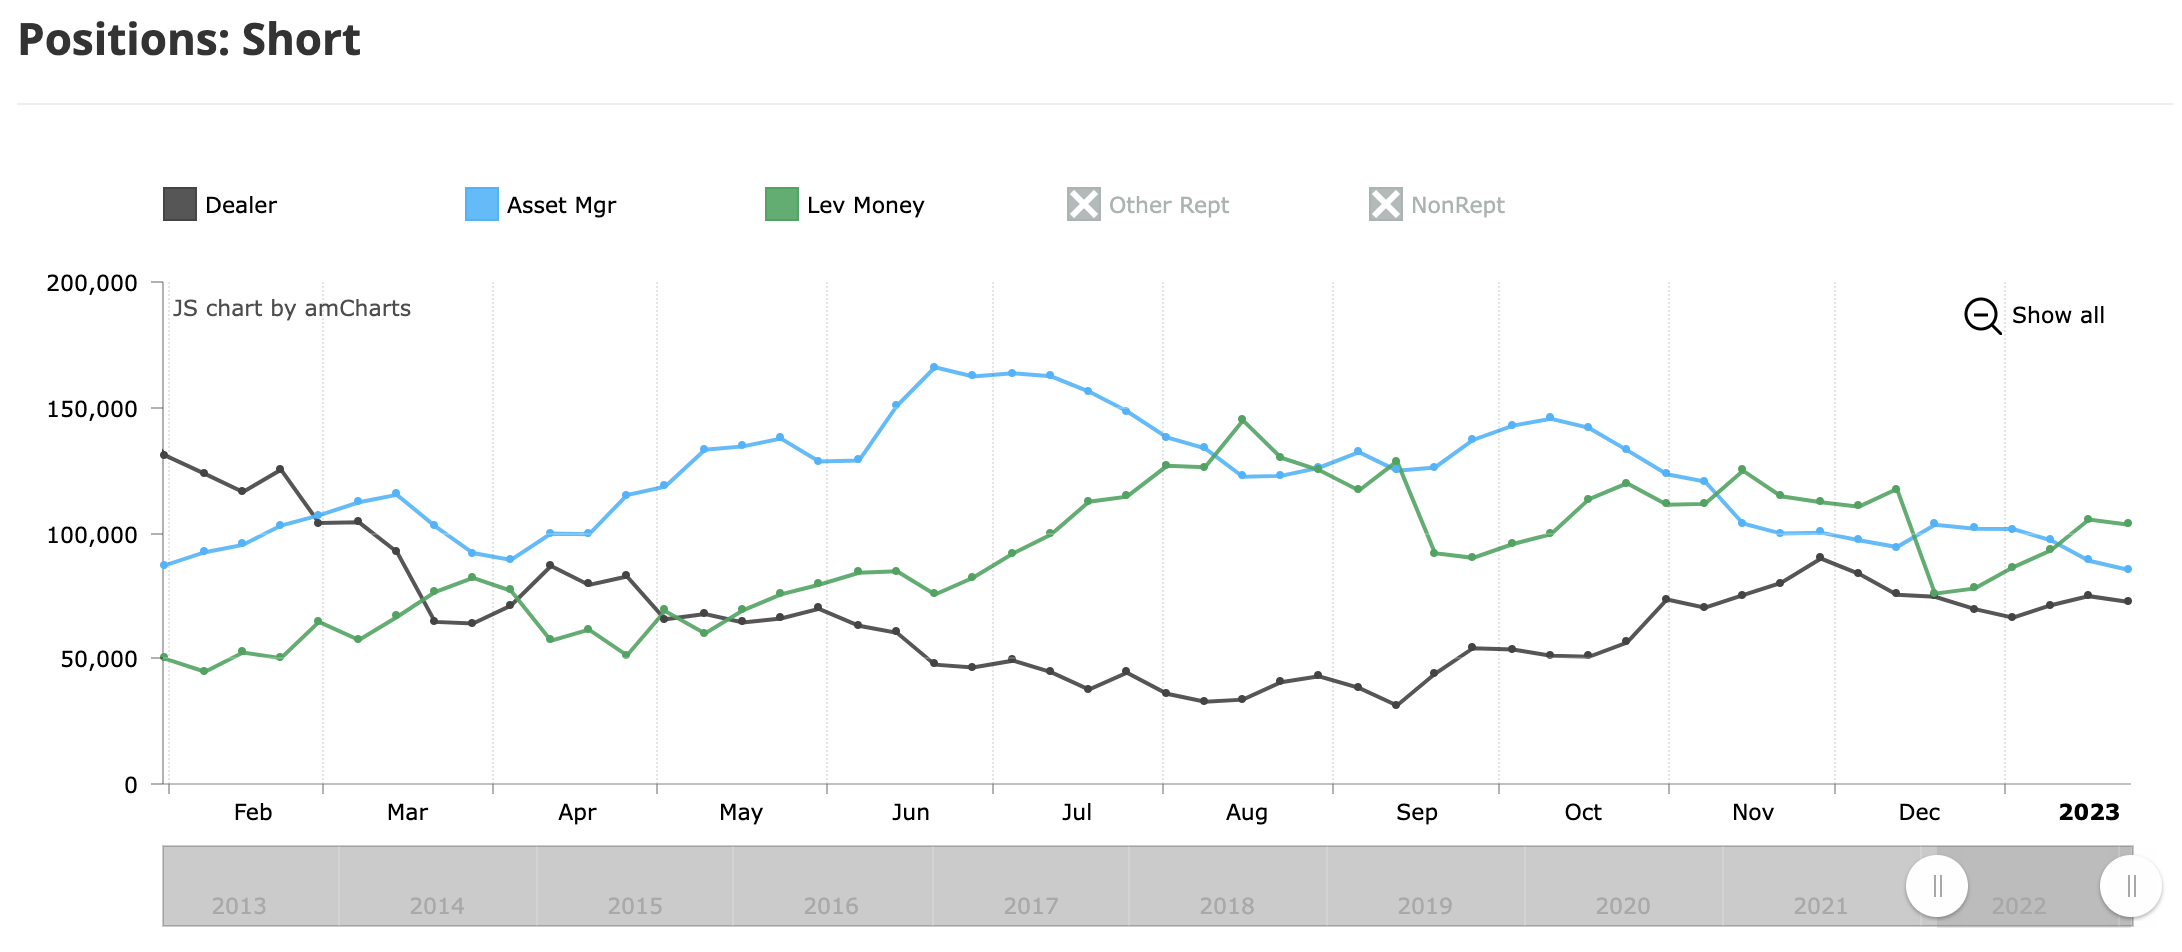
Players Analysis - The Commitment of Traders (COT) Reports for the S&O 500 show that the recent rally was not driven by asset managers or hedge funds adding long positions. It was actually driven by asset managers exiting short positions. A short squeeze rally. It is possible that asset managers are waiting for lower prices or a change in the macro picture to buy long positions with conviction.

Seasonality - The seasonality chart of the S&P 500 below shows that there is typically weakness starting in the second half of February. Often, this provides a buying opportunity for the Easter rally that occurs in April.

Cycles - The Combined Cycle is projecting market weakness that starts around 2/13 and could last until 4/8.

Conclusion - Given all of the factors analyzed, it would be wise for investors and traders to plan for a pullback that may have already started. Weakness is expected to be shallow and choppy. Since margin debt is significantly lower than last year, a waterfall, “sell everything” selloff is unlikely. It would be prudent for investors and traders to prepare a watchlist for investments that could be bought at a discount over the next few weeks.